Search

Description
The data presents a result of near field measurements of electromagnetic emissions radiated from the PCB of a small electronic device. An efficient method of modelling the magnetic and electric field emissions is the measurements in the near field using electric and magnetic probes. The attached files contain magnetic field maps created on based measurements using H-field Probe LF-B 3 in the frequency range 100 kHz – 50 MHz. The designated maps enable the location of the sources of high magnetic fields radiated by the tested device. The device under test (DUT) was a typical astable multivibrator supplied from a battery of 9 V (Fig. 1).
Twenty-five measurement points are marked on the PCB, located exactly above the elements of the DUT (Fig. 2). The near fields were measured directly on the surface of PCB. The probe was placed at the same distance from the PCB surface, regardless of the height of the elements. The probe LF-B 3 is a passive near-field probe. It detects magnetic field lines emitted from the measured object at 90°. Magnetic field lines, which enter the probe laterally, are not detected. The probes provide a high resolution of less than 2 mm. The average value of the voltage at the probe output was measured at all points with an oscilloscope. Each measurement was performed for the averaged instantaneous values (the number of averages above 300) for both the background, i.e. the device turned off and the device turned on. All results of measurements made with near field probes are presented in mV. This is due to the measurement of the voltage at the output of the probe for both electric and magnetic fields. In Figure 3, the near-field measurement system developed to measure the radiated emission is shown.
The attached files contain magnetic field maps and the table with the measurement results.
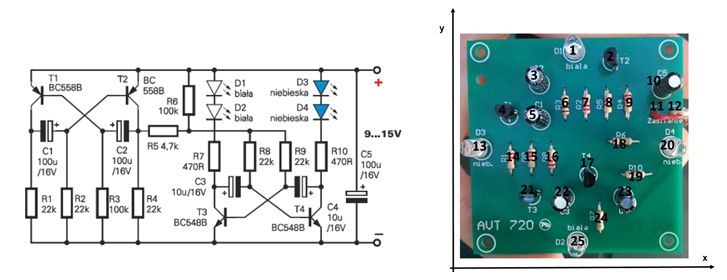
Figure 1. The electronic diagram of the AVT 720 device
Figure 2. Arrangement of measurement points on the DUT
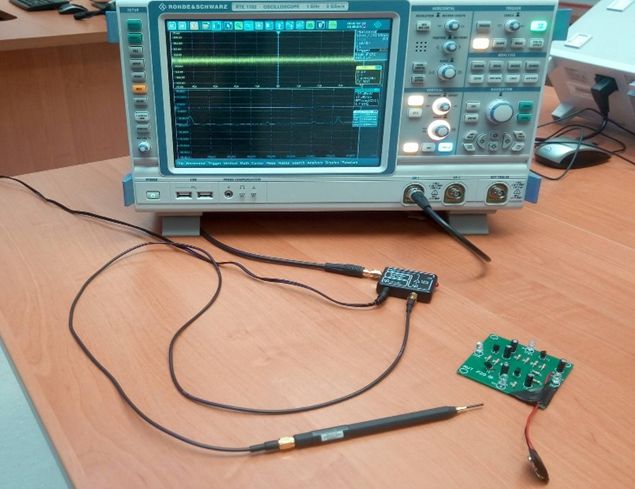
Figure 3. The near-field measurement system
Dataset file
hexmd5(md5(part1)+md5(part2)+...)-{parts_count} where a single part of the file is 512 MB in size.Example script for calculation:
https://github.com/antespi/s3md5
File details
- License:
-
 open in new tab
CC BY-NCNon-commercial
open in new tab
CC BY-NCNon-commercial
Details
- Year of publication:
- 2021
- Verification date:
- 2021-07-28
- Creation date:
- 2018
- Dataset language:
- English
- Fields of science:
-
- Automation, electronic and electrical engineering (Engineering and Technology)
- DOI:
- DOI ID 10.34808/7kw6-bw71 open in new tab
- Series:
- Verified by:
- Gdańsk University of Technology
Keywords
- near field measurement
- electromagnetic emissions
- small electronic device
- magnetic field
- magnetic probe
- magnetic field maps
- H-Field Probe
- PCB
References
- dataset Magnetic field maps of an astable multivibrator in frequency range from 30 MHz to 3 GHz – selective detection
- dataset Electric field maps of an astable multivibrator in frequency range from 30 MHz to 3 GHz
- dataset Magnetic field maps of an astable multivibrator in frequency range from 30 MHz to 3 GHz – spatial detection
Cite as
Authors
seen 168 times