Description
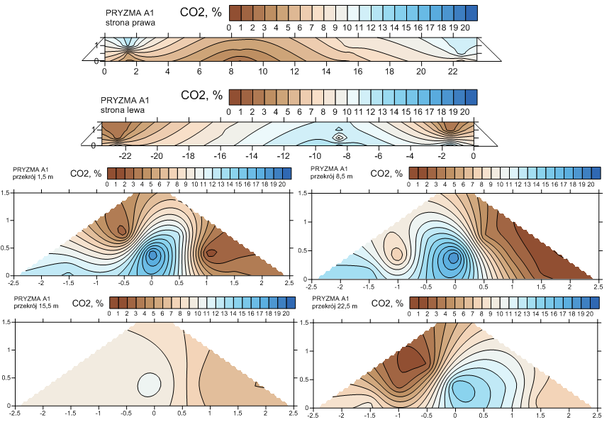
The dataset contains the color-coded isophlets illustrating the spatial distribution of gas concentrations (CO, CO2, O2 and NO) and the temperature in biowaste composting pile during 6 weeks of process. Four cross sections and two longitudinal cross sections (the left and right sides of the pile) were made using Surfer 10 software (Golden Software, Cracow, Poland).
A small subset (16 cross sections) illustrates the chimney effect in the pile and the temperature effect on CO distribution is presented in the manuscript: https://doi.org/10.3390/su11082340.

The dataset contains 6 folders - one for each week of composting process (called: "1 tydzień", "2 tydzień", "3 tydzień", "4 tydzień", "5 tydzień" and "6 tydzień").
In each folder there are 5 graphic files in the .png extension with a resolution of 300 dpi, named: "CO" (spatial distribution of carbon monoxide), "CO2" (spatial distribution of carbon dioxide, example on the left), "NO" (spatial distribution of nitric oxide), "temp" (spatial distribution of temperature) and "tlen" (spatial distribution of oxygen).
For each of the views in the upper left corner there is a label with measurement point (left/right side of the pile or number of the cross-section). The scale with the unit (concentration in % or ppm, temperature in°C) is placed next to the label.
Dataset file
hexmd5(md5(part1)+md5(part2)+...)-{parts_count} where a single part of the file is 512 MB in size.Example script for calculation:
https://github.com/antespi/s3md5
File details
- License:
-
open in new tab
CC BYAttribution
Details
- Year of publication:
- 2019
- Verification date:
- 2022-10-18
- Dataset language:
- Polish
- DOI:
- DOI ID 10.34808/j6x8-jt17 open in new tab
- Verified by:
- No verification
Keywords
References
Cite as
Authors
seen 208 times
