Search
Experimental investigation of the weight averaging of pulse frequency modulated sensor output signal

Description
The research aims to practically verify the results of theoretical analysis and simulations of the efficiency of weight averaging of pulse frequency modulated signal. For this purpose, a suitable test stand was built, and the control software in the LabVIEW environment was prepared. Then, a series of experiments were carried out to process and analyze the output signal of the actual Voltage to Frequency Converter (VFC).
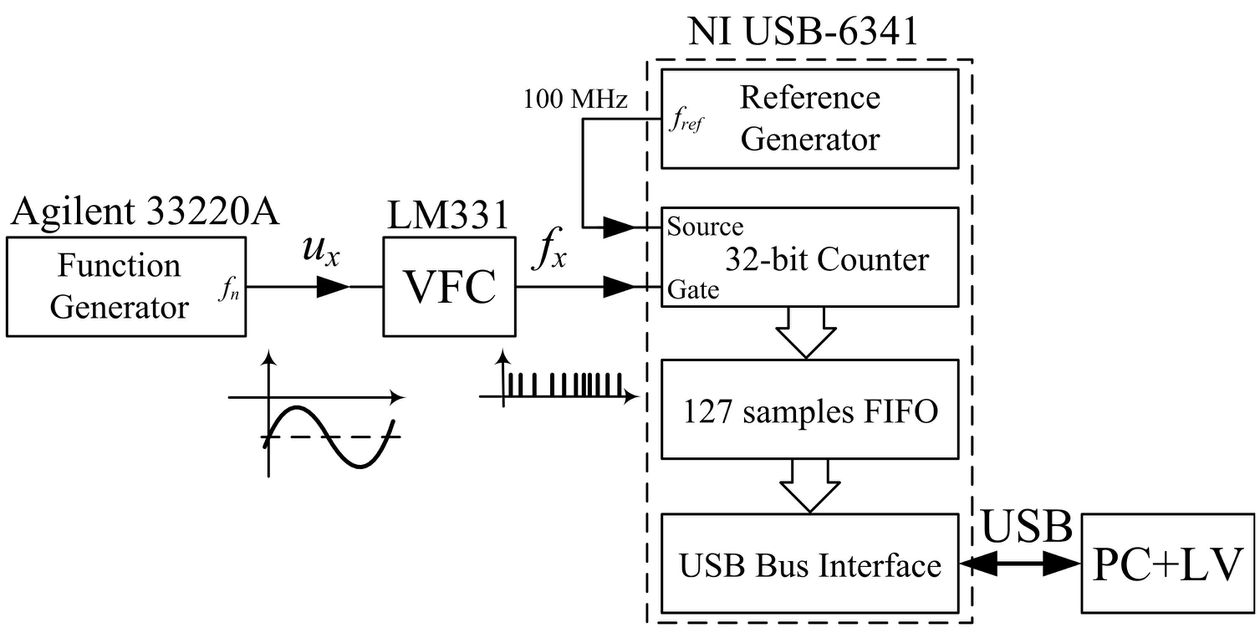
Figure shows a block diagram of the measurement system used. The implemented VFC converter was based on an LM331 integrated circuit, which converts the negative input voltage to the pulse output frequency according to the relationship fx(t)=Sf ux(t), where: Sf is the sensitivity of the converter, ux(t)is the input voltage, and fx(t) is the output. The sensitivity Sf of the LM331 converter has a negative value: Sf = –1 kHz / V. An Agilent 33220A programmable function generator was used as the source of the input voltage ux(t). The VFC input voltage was the sum of the DC and AC component: ux(t)=UDC + Umcos(2pfnt+jn), where Um, fn and φn is the amplitude, frequency, and initial phase of the test signal AC component, respectively. Measurements of the VFC pulse frequency output signal were made using a pulse counter and the "on-the-fly" reading method. The National Instruments USB-6341 measurement board and a program written in the LabVIEW environment were used for this purpose. The signal from the Agilent 33220A generator was passed to the input of the VFC converter, the output signal of which was passed to the GATE input of the counter. The counter was configured to operate in the "Finite Buffered Edge Counting" mode. The LabVIEW program reads counter states stored in the FIFO register and calculates the values of the weighting function and the result of measurement of the VFC output frequency. The measurement is repeated 100 times and the NMRR is calculated. The control software was prepared in LabVIEW environment. Complete documentation for prepared LabVIEW application is available in the LabVIEW_documentation\ directory, the main documentation file is: Weight_Averaging_Main_Program.html. The most important part of the presented algorithm is weight averaging of the frequency signal. For example, file Blackman-Harris_windowd.jpg shows an exemplary diagram of the averaging algorithm with the Blackman-Harris weighting function. Other files respectively.
Three series of measurements were carried out. The first one was made in a wide frequency range from 2 Hz to 1000 Hz with the step of 2 Hz (500 points), with a constant amplitude Um = 2.5 V and constant DC component UDC = –5 V. The series of these measurements were carried out four times for a different averaging window with appropriately selected averaging time: rectangular window, time 20 ms, triangular window, time 40 ms, Blackman window, time 60 ms, and Blackman-Harris window, time 80 ms. Each measurement point on the graph was calculated by averaging 100 measurements. The second one was made in a narrow frequency range from 48 Hz to 52 Hz with the step of 0.02 Hz (201 points), at the same constant value of the DC and AC components as before. The last series was performed in a narrow frequency range from 48 Hz to 52 Hz with the step of 0.02 Hz (201 points), for different values of the DC and AC components. All obtained measurement results are available as Excel files in the Excel_data_files\ directory, and as LabVIEW bit maps charts in the LabVIEW_bitmap_charts\ directory.
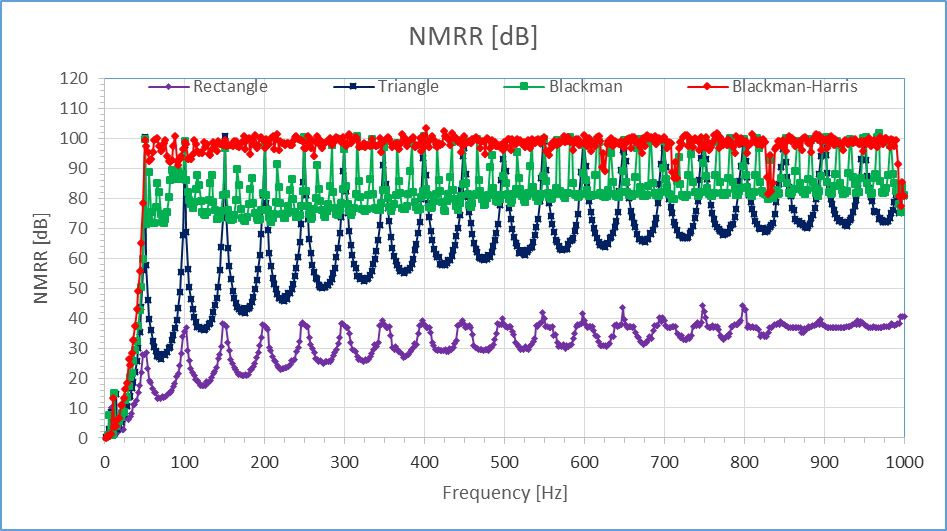
Figure shows a comparison of NMRR as a function of interference frequency in the range of 2 Hz-1000 Hz with step 2 Hz (500 points), for four windows (rectangular, triangular, Blackman and Blackman-Harris) with appropriately selected averaging times: 20 ms, 40 ms, 60 ms and 80 ms, respectively. The completed measurements confirm the theoretical dependence that the worst is the rectangular window, for which NMRR is only 40 dB. For the other: triangular, Blackman, and Blackman-Harris windows (with appropriately selected averaging times), the maximum NMRR values are close to 100 dB. However, the triangular window shows an extensive variation in NMRR from 30 dB to 100 dB, while for the Blackman this variation is from 70 dB to 100 dB, and for the Blackman-Harris window merely from 95 dB to 100 dB. Thus, the experiments confirmed the very good theoretical properties of the Blackman and Blackman-Harris windows when applied to the weight averaging of the pulse frequency signal.
Dataset file
hexmd5(md5(part1)+md5(part2)+...)-{parts_count} where a single part of the file is 512 MB in size.Example script for calculation:
https://github.com/antespi/s3md5
File details
- License:
-
 open in new tab
CC BYAttribution
open in new tab
CC BYAttribution
Details
- Year of publication:
- 2022
- Verification date:
- 2022-09-14
- Creation date:
- 2022
- Dataset language:
- English
- Fields of science:
-
- Automation, electronic and electrical engineering (Engineering and Technology)
- information and communication technology (Engineering and Technology)
- DOI:
- DOI ID 10.34808/79d9-pt39 open in new tab
- Verified by:
- Gdańsk University of Technology
Keywords
- signal
- pulse-frequency
- modulation
- weight function
- on-the-fly reading
- Finite Buffered Edge Counting
- LabVIEW
- pulse counting
- VFC
- Voltage to Frequency Converter
References
Cite as
Authors
seen 188 times