Search
Voltage fluctuations on the main switchgear of the industrial power system supplying the rolling mill motors

Description
The dataset presents the voltage waveforms on the bus bars of the main switchgear of the industrial power network for the supply of rolling mills. The data was recorded during an experiment whose purpose was to determine a level of short-term and long-term flicker caused by voltage fluctuations. In the virtual application of flickermeter, a hardware (acquisition of measuring data) and a software (computer data processing and graphical interface ) part can be distinguished. The attached dataset contains raw data at the output of the hardware part of the flickermeter.
The measurements were carried out in one of the Polish steel mills, in the GST- 6 switching station, on medium voltage (6 kV) switchgear rails in measurement field 2a using voltage transformers. The voltage value on the secondary side of the transformers was 100/root(3) V (a phase voltage). Field 3a of the switchboard supplies the rolling mill motor, whose operation causes voltage fluctuations. The scheme of the switchgear with the measuring point marked is shown in Figure 1. The measurement lasted five hours from 11:10 to 16:10. After the initial rolling period (until 11:30), there was a break in the rolling mill operation until about 14:20.
Measurements were performed using a measurement system that allows simultaneous measurement of three phase-to-phase or two-phase voltages. In the hardware part of the measuring system (Figure 2), the signal is first pre-conditioned. The analog signal processing consists of matching the level of the measured signal to the inputs of the optoisolation amplifier, which ensures the separation of the high voltage signal. Then low-pass filtration through a set of anti-aliasing filters is carried out. The formation of the output digital signal from the analog signal takes place in the A/D converter with a 16-bit resolution and a sampling rate of up to 20 kS/s.
The sampling frequency is equal to 20 000 Hz and is inserted in the first row of the attached files.
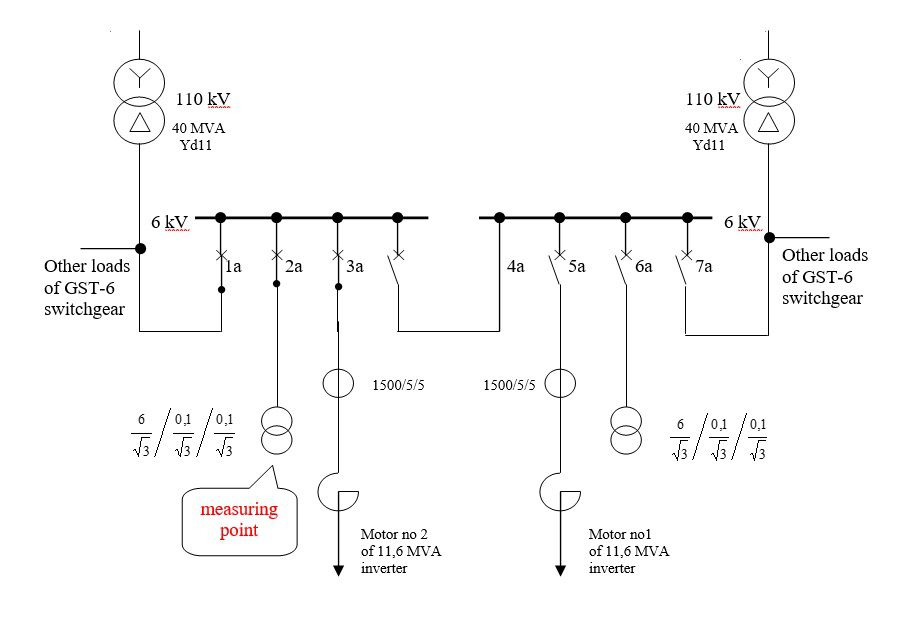
Figure 1. The scheme of the switchgear with the measuring point marked
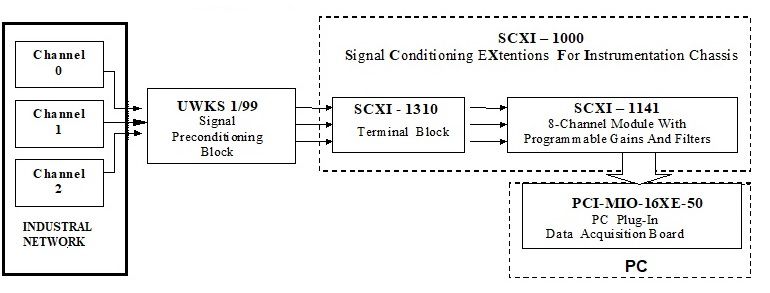
Figure 2. The hardware part of the measurement system
Dataset file
hexmd5(md5(part1)+md5(part2)+...)-{parts_count} where a single part of the file is 512 MB in size.Example script for calculation:
https://github.com/antespi/s3md5
File details
- License:
-
 open in new tab
CC BYAttribution
open in new tab
CC BYAttribution - Raw data:
- Data contained in dataset was not processed.
Details
- Year of publication:
- 2020
- Verification date:
- 2020-12-17
- Creation date:
- 2000
- Dataset language:
- English
- Fields of science:
-
- Automation, electronic and electrical engineering (Engineering and Technology)
- DOI:
- DOI ID 10.34808/wv44-3z34 open in new tab
- Series:
- Verified by:
- Gdańsk University of Technology
Keywords
References
- dataset The instantaneous flicker sensation level measured in the industrial power system supplying the rolling mill motors
- dataset A cumulative probability function of instantaneous flicker sensation values measured in the industrial power system supplying the rolling mill motors
- dataset Voltage fluctuations on the main switchgear of the industrial power system supplying the rolling mill motors_part_2
- dataset The short-term flicker severity level measured in the industrial power system supplying the rolling mill motors
- dataset The voltage on bus bars of the main switchboard of the ro-ro ship electrical power system during a sea voyage
Cite as
Authors
seen 250 times