Search

Description
The dataset contains the results of numerical modeling of sea ice in the Baltic Sea since 1998. A long-term reanalysis was performed using the three-dimensional hydrodynamic model PM3D (Kowalewski and Kowalewska-Kalkowska, 2017), a new version of the M3D model (Kowalewski, 1997). A numerical dynamic-thermodynamic model of sea ice (Herman et al. 2011) was coupled to the analysis of ice conditions variability.
The model is based on the Princeton Ocean Model (POM) developed at Princeton University (Blumberg and Mellor, 1987). Like POM, the M3D/PM3D model uses the Mellor-Yamada turbulence scheme and sigma vertical coordinates. The simulation was carried out in a rectangular grid of 3' (latitude) and 6' (longitude) resolution. The spatial resolution was 3 nautical miles, i.e. about 5.5 km. An open boundary was located between the Skagerrak and the Kattegat along the parallel connecting Skagen and Göteborg, where the water exchange with the North Sea takes place. A radiation condition based on Somerfield’s concept for velocities vertically averaged and normal to the boarder plane was applied.
Weather forcing since 1998 was carried out using the results of operational numerical forecasts conducted by ICM University of Warsaw using the Unified Model (UM) developed by Met Office. The PM3D model uses the assimilation of sea surface temperature from the satellite (SST) and measurements of salinity and water temperature from ships at standard depths as part of ICES monitoring.
Daily spatial distributions of sea ice thickness and concentration were recorded in the model's computational grid in unprojected form (LatLong, WGS 84, EPSG: 4326). Ice thickness is expressed in meters and ice concentration (fraction) is expressed as the ratio of the ice covered area to the total area of the grid.
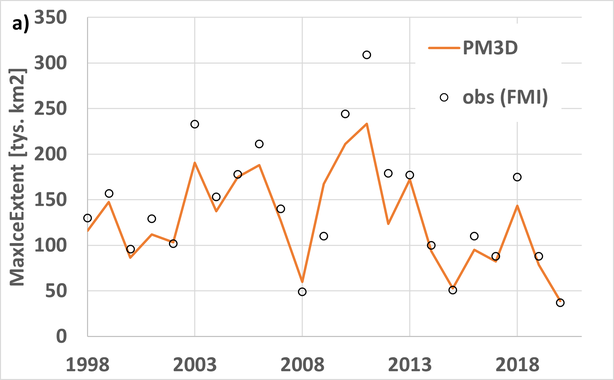
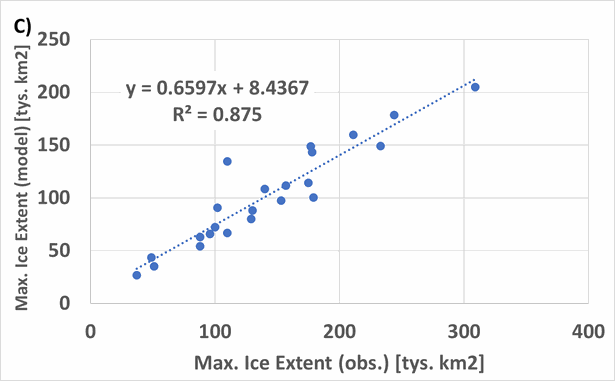
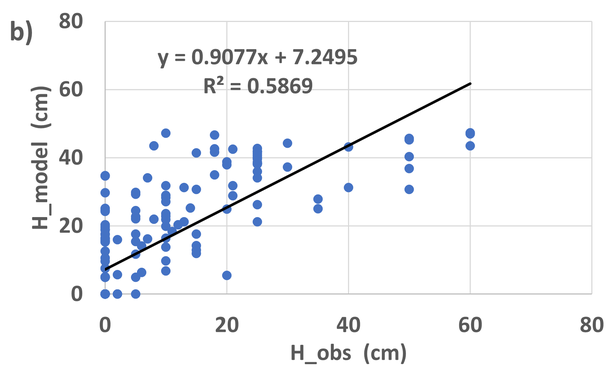
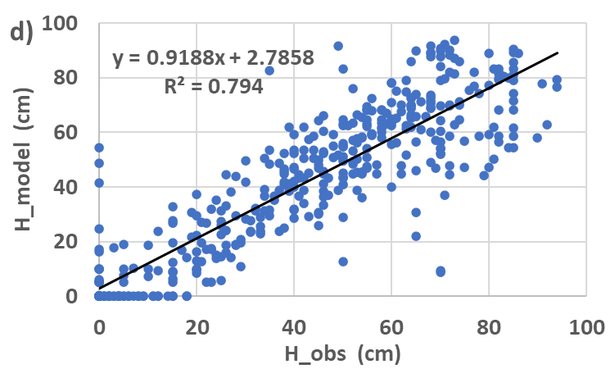
Comparison of modeled and observed (FMI) maximum ice extent in the Baltic Sea (a), (c) and ice thickness at FMI stations (b) Airisto and (d) Hailuoto
Dataset file
hexmd5(md5(part1)+md5(part2)+...)-{parts_count} where a single part of the file is 512 MB in size.Example script for calculation:
https://github.com/antespi/s3md5
File details
- License:
-
 open in new tab
CC BY-NC-SANon-commercial - Share-alike
open in new tab
CC BY-NC-SANon-commercial - Share-alike - Software:
- Software for Manipulating or Displaying NetCDF Data
Details
- Year of publication:
- 2021
- Verification date:
- 2021-08-31
- Creation date:
- 2021
- Dataset language:
- English
- DOI:
- DOI ID 10.34808/b443-2s40 open in new tab
- Series:
- Verified by:
- Gdańsk University of Technology
Keywords
References
- publication Mean annual and seasonal circulation patterns and long-term variability of currents in the Baltic Sea
- publication A three-dimensional, hydrodynamic model of the Gulf of Gdańsk
- publication Sensitivity of the Baltic Sea level prediction to spatial model resolution
- publication 44 Years Hindcast of the sea level and circulation in the Baltic Sea
- publication Numerical modelling of thermodynamics and dynamics of sea ice in the Baltic Sea
- dataset Hydrodynamic reanalysis of water temperature and salinity in the Baltic Sea using the PM3D model
- dataset Long-term hindcast simulation of sea ice in the Baltic Sea
- dataset Hydrodynamic reanalysis of currents in the Baltic Sea using the PM3D model
- dataset Hydrodynamic reanalysis of sea level in the Baltic Sea using the PM3D model
Cite as
Authors
seen 209 times