Description
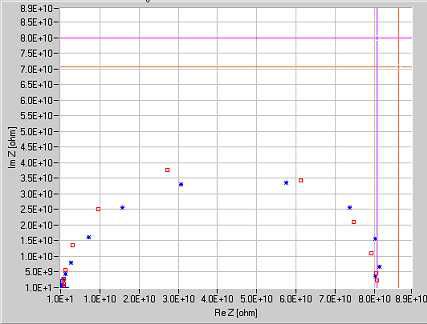
The impedance spectrum of high-voltage ZnO varistor obtained using FRA EIS impedance spectrosocpy measurement method. The 1V sinusoidal excitation was used. The frequency range was chosen from 10 kHz down to 10 uHz. The object under test and the measuring instrument were placed in a Faraday cage due to high impedance of the object. The data was acquired using Atlas-Sollich 0441 High-impedance Analyser. The varistor details were described in the referenced paper.

The graph presents measurement points (blue asterisks) and results of model fitting (red squares)
Rg=(750±390)Mohm; R=(80±0,9)Gohm; C=(5,7±0,2)nF;
Dataset file
440 O m 68 75 28 _11.10k_10uHz.txt
2.9 kB,
S3 ETag
ee950d6d438094481e74cde6185697de-1,
downloads: 68
The file hash is calculated from the formula
Example script for calculation:
https://github.com/antespi/s3md5
hexmd5(md5(part1)+md5(part2)+...)-{parts_count} where a single part of the file is 512 MB in size.Example script for calculation:
https://github.com/antespi/s3md5
File details
- License:
-
open in new tab
CC BY-NCNon-commercial
Details
- Year of publication:
- 2021
- Verification date:
- 2021-03-22
- Dataset language:
- English
- Fields of science:
-
- Automation, electronic and electrical engineering (Engineering and Technology)
- DOI:
- DOI ID 10.34808/kqqv-yq22 open in new tab
- Series:
- Verified by:
- Gdańsk University of Technology
Keywords
References
Cite as
Authors
seen 149 times

