Search
The voltage on bus bars of the main switchboard of the car carrier electrical power system at sea trials during a bow thruster start-up

Description
The dataset is a part of the research results on the quality of supply voltage on bus bars of the main switchboard of the ship's electrical power system in different states of ship exploitation. In ships' electrical power systems, disturbances occurring in voltage waveforms on bus bars of the main switchboard are connected mainly with the processes of switching large loads on and off, such as switching on the bow thruster propulsion. The attached dataset contains the measurement results obtained onboard the car carrier during sea trials when a bow thruster start-up.
The bow thruster propulsion motor with a power of 1300 kW consumed 3 kA during the start-up (nominal current 2.2 kA). The nominal power of a single generating set was 1400 kW, with a nominal current of 2.25 kA. For the studied case, the start-up was carried out in the parallel operation of two generating sets. Right before the start-up, the load of each generator set was 840 kW (60% of the nominal load of the ship's power plant at the time of commissioning). Immediately after the start-up, an emergency shutdown of less important receivers by the Mayer system was observed. At the same time, an additional generating set was launched because of overloading the ship's power plant. Despite this, there was no emergency shutdown, so-called black-out, of working generating sets.
The voltage waveforms on bus bars of the main switchboard were recorder with the digital measuring system, which allows the simultaneous measurement of three phase-to-phase or two-phase voltages. The initial conditioning of the input signals is carried out by optoisolation amplifiers and a low-pass filter module (antialiasing). The formation of the output digital signal from the analog signal takes place in the a/d converter with a resolution of 16 bits and a sampling rate of up to 20 kS/s. The block diagram of the digital measuring system is shown in Figure.
The files contain voltage waveforms of the output of a/d converters in [V], in three phases for the 440 V network. The attenuation and offset of the measuring path for the 440 V network are equal to 134.0123 [V / V] and -0.0175 V, respectively. The sampling frequency is inserted in the first row of the attached files.
The files are described as follows: car_carrier_thruster_440_the number of the set.
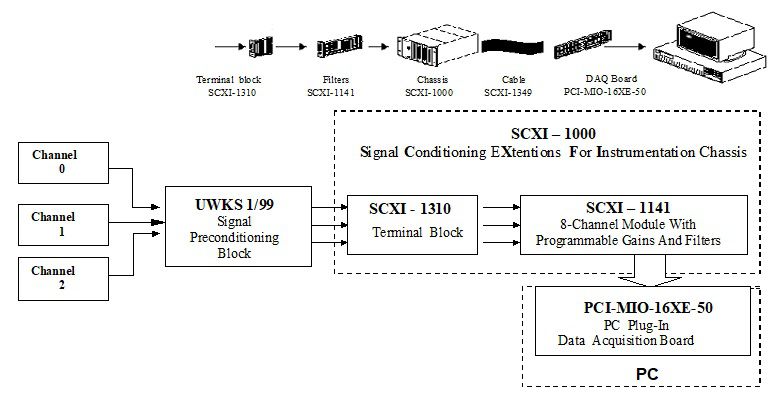
The block diagram of the digital measuring system
Dataset file
hexmd5(md5(part1)+md5(part2)+...)-{parts_count} where a single part of the file is 512 MB in size.Example script for calculation:
https://github.com/antespi/s3md5
File details
- License:
-
 open in new tab
CC BYAttribution
open in new tab
CC BYAttribution - Raw data:
- Data contained in dataset was not processed.
Details
- Year of publication:
- 2020
- Verification date:
- 2020-12-17
- Creation date:
- 2000
- Dataset language:
- English
- Fields of science:
-
- Automation, electronic and electrical engineering (Engineering and Technology)
- DOI:
- DOI ID 10.34808/25c4-cc93 open in new tab
- Verified by:
- Gdańsk University of Technology
Keywords
- quality of supply voltage
- bus bars of main switchboard
- ship's electrical power system
- car carrier
- sea trials
- bow thruster
References
- dataset The voltage on bus bars of the main switchboard of the car carrier electrical power system during sea trials
- dataset The voltage on bus bars of the main switchboard of the car carrier electrical power system at sea trials during maneuvering
- dataset The voltage on bus bars of the main switchboard of the car carrier electrical power system at sea trials during a sea voyage
Cite as
Authors
seen 195 times