Wyszukiwarka

Opis
The dataset contains the results of simulations that are part of the research on modelling the multipath fading in the communication channel. The lognormal fading envelope is generated using the Monte-Carlo simulation (MCS) in the LabVIEW programming environment.
The term large-scale fading denotes the variations of the mean envelope or mean power of a received signal. Lognormal statistics can describe the slow variation of the mean signal level for outdoor and indoor environments. This phenomenon is referred to as shadowing from terrain, trees and buildings. The lognormal distribution is usually used to represent the long-term characteristics of the mobile radio channel.
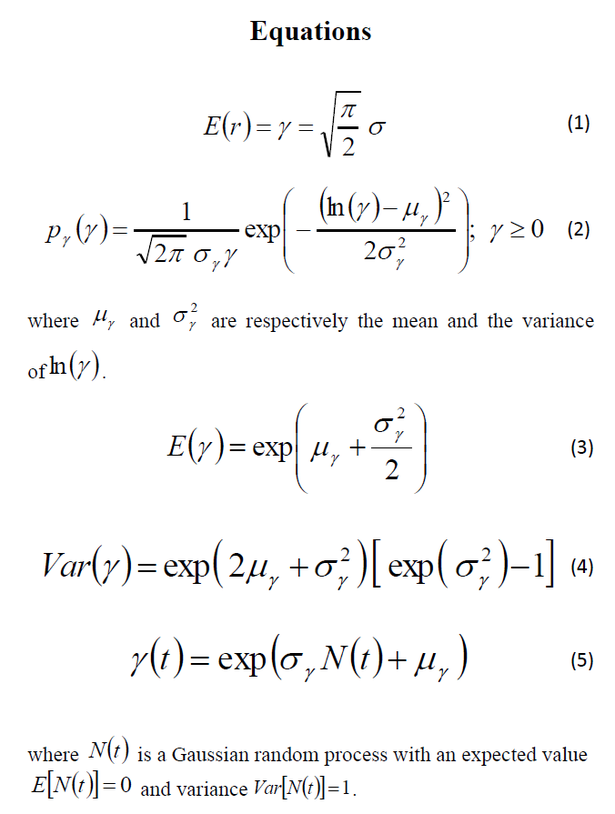
The mean envelope level of the received signal is defined by Equation (1). The distribution of this variable, called the lognormal variable, is given by Equations (2). Its expected value and variance are expressed by Equations (3) and (4), respectively. The normal logarithm of the lognormal variable has a normal distribution. The lognormal processes can be derived through the nonlinear transformation of the lognormal variable that specifies the model applied in the MCS (Equations 5).
The MCS provides a general approach to numerically approximating the distribution function for the value of the output quantity Y(t) = f(X) (where Y(t) is a single (scalar) output quantity. X represents the N input quantities (X1(t), . . . ,XN(t))T .
The inputs to the Monte Carlo simulation procedure are:
- the model Y(t) = f(X),
- the probability density functions for input quantities X1(t), . . . ,XN (t),
- the number M of Monte Carlo trials.
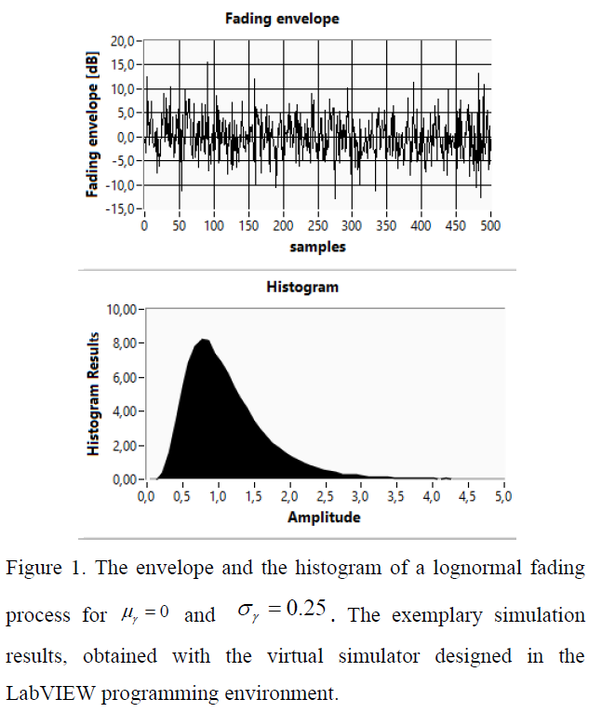
X1(t)= N(t) are is Gaussian random process with expected value equal to 0 and variance equal to 1, i.e. N(0,1). The number of Monte Carlo trials is equal to 100 000. The exemplary simulation results obtained with the virtual simulator designed in the LabVIEW programming environment are shown in Fig. 1.
The simulations were carried out for both different standard deviation values and the mean of the normal logarithm of the lognormal variable.
The attached files contain two columns related to fading envelope: the number of samples and the amplitude of fading envelope in [dB] and two columns related to the histogram: the number of bins and the histogram results in percents of total amplitude. Files can be opened in both the LabVIEW software and Windows Office Notepad.
The files are described as follows: MCS_lognorm_the mean value_the standard deviation.
Plik z danymi badawczymi
hexmd5(md5(part1)+md5(part2)+...)-{parts_count} gdzie pojedyncza część pliku jest wielkości 512 MBPrzykładowy skrypt do wyliczenia:
https://github.com/antespi/s3md5
Informacje szczegółowe o pliku
- Licencja:
-
 otwiera się w nowej karcie
CC BY-NCUżycie niekomercyjne
otwiera się w nowej karcie
CC BY-NCUżycie niekomercyjne
Informacje szczegółowe
- Rok publikacji:
- 2021
- Data zatwierdzenia:
- 2021-05-31
- Data wytworzenia:
- 2021
- Język danych badawczych:
- angielski
- Dyscypliny:
-
- informatyka techniczna i telekomunikacja (Dziedzina nauk inżynieryjno-technicznych)
- DOI:
- Identyfikator DOI 10.34808/00nm-jp78 otwiera się w nowej karcie
- Seria:
- Weryfikacja:
- Politechnika Gdańska
Słowa kluczowe
- multipath fading
- communication channel
- Monte-Carlo simulation
- lognormal distribution
- large-scale fading
Powiązane zasoby
- dane badawcze The Suzuki model of the multipath fading channel
- dane badawcze The generalized Suzuki model of the multipath fading channel
- dane badawcze The Weibull model of the multipath fading channel
- dane badawcze The α-µ model of the multipath fading channel
- dane badawcze The Rayleigh model of the multipath fading channel
Cytuj jako
Autorzy
wyświetlono 246 razy