Description
The dataset is a part of the research results on the quality of supply voltage on bus bars of the ship's electrical power system's main switchboard in different states of ship exploitation. The attached dataset contains the results of a harmonic distortion analysis expressed by the total harmonic distortion (THD) coefficient of voltage waveforms recorded during measurements. The measurements were carried out onboard various ships: ferry, ro-ro, and car -carrier.
Each ship contains a three-phase, three-wire electrical power system. The ferry and ro-ro systems' electrical power plant consists of free-standing generating sets and shaft generators. The source of electrical power is three-phase synchronous generators driven by auxiliary diesel engines. Additionally, shaft generators driven by the propeller shaft of the main engine are used. The ferry’s electrical power plant consists of three free-standing generators of 1400 kVA each, and two shaft generators of 1375 kVA each. The main switchboard's nominal voltage on the bus bars was 380 V with a frequency equal to 50 Hz. The ferry was equipped with two free-standing generators of 1000 kVA each and two shaft generators of 1500 kVA. The nominal voltage on the main switchboard's bus bars was 400 V at a frequency of 50 Hz. The car carrier’s electrical power plant consists of six free-standing generators of 1500 kVA each. The main switchboard's nominal voltage on bus bars was 3300 V and 440 V with a frequency equal to 60 Hz. All ships were capable of generating the voltage of 220V, and after transformation – 440V, 400V, and 380V.
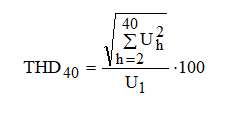
The voltage waveforms on the main switchboard's bus bars were recorded with the digital measuring system, which allows the simultaneous measurement of three phase-to-phase or two-phase voltages. Its hardware part consists of a signal preconditioning block, an antialiasing filter, and a data acquisition board with a resolution of 16 bits and a sampling rate of up to 20 kS/s. The maximum sampling rate is equal to 6.6 kS/s for using three channels at the same time. The virtual part of the system is realized in the graphical programming environment LabVIEW. The THD is calculated as the equivalent root mean square (rms) voltage of a set of the harmonic frequencies (from the 2nd harmonic on to 40th harmonics) over the rms voltage of the fundamental frequency. The data were multiplied by the Hann window function. The frequency analysis was made using a fast Fourier transform (FFT) for the time frame of 2048 samples. The calculated Fourier transforms components were averaged 10 times. The final THD value was obtained based on the instantaneous values averaged over 40 minutes of the observation time.

where:
Uh - the rms voltage of the h-th harmonics
U1 - the rms voltage of the fundamental frequency
Dataset file
hexmd5(md5(part1)+md5(part2)+...)-{parts_count} where a single part of the file is 512 MB in size.Example script for calculation:
https://github.com/antespi/s3md5
File details
- License:
-
open in new tab
CC BYAttribution
Details
- Year of publication:
- 2020
- Verification date:
- 2021-01-04
- Creation date:
- 2020
- Dataset language:
- English
- Fields of science:
-
- Automation, electronic and electrical engineering (Engineering and Technology)
- DOI:
- DOI ID 10.34808/r3h7-d082 open in new tab
- Verified by:
- Gdańsk University of Technology
Keywords
- Harmonic distortion
- Total harmonic distortion (THD)
- ship's electrical power system
- ro-ro
- ferry
- quality of supply voltage
- electrical power plant
- car-carrier
References
- dataset The voltage on bus bars of the main switchboard of the car carrier electrical power system at sea trials during maneuvering
- dataset The voltage on bus bars of the main switchboard of the ferry electrical power system during a sea voyage
- dataset The voltage on bus bars of the main switchboard of the car carrier electrical power system during sea trials
- dataset The voltage on bus bars of the main switchboard of the car carrier electrical power system at sea trials during a sea voyage
- dataset The voltage on bus bars of the main switchboard of the ferry electrical power system during a layover at the port
- dataset The voltage on bus bars of the main switchboard of the ro-ro ship electrical power system during a sea voyage
- dataset The voltage on bus bars of the main switchboard of the ro-ro ship electrical power system during maneuvering
- dataset The voltage on bus bars of the main switchboard of the ro-ro ship electrical power system during a layover at the port
- dataset The voltage on bus bars of the main switchboard of the ferry electrical power system during maneuvering
Cite as
Authors
seen 195 times

