Wyszukiwarka

Opis
The data set contains high resolution sea surface temperature (SST) maps estimated from Landsat 8 Level 1 Thermal Infrared Sensor (TIRS) data using NLSST algorithm. SST was calculated only for granules (185 x 180 km) from satellite path number 190, that covered at least 2000 km2 of the cloud-free area of the Baltic Sea.
The Landsat mission is run by the Earth Observation Program of the National Aeronautics and Space Administration (NASA). Launched in 2013, Landsat 8 carries two instruments: a Thermal Infrared Sensor (TIRS) collecting infrared data of 100-m resolution and an Operational Land Imager (OLI) which collects data of 30-m resolution in the visible (VIS), near-infrared (NIR) and short-wave infrared (SWIR) portions of the spectrum. Data from both instruments are provided by the USGS in a common grid in UTM projection with a resolution of 30 m. Each satellite path is revisited every 16 days. Of the path 190, eight granules cover the Baltic Sea area (Figure 1).
The NLSST algorithm is an empirical formula utilising split-window approach to atmospheric correction (Walton et al. 1998). To calculate SST, Level 1 satellite data form the Collection 2 (USGS/NASA Landsat Program) and NLSST coefficients derived for the Baltic Sea in reference to in situ bulk temperatures from buoys and platforms were used (Bradtke 2021). Clouded areas were masked (fill value -999). The validation of the results for the period 2013-2019 showed a root mean square error (RMSE) 0.65 °C and bias 0.02 °C.
The SST maps are provided in GeoTIFF format using the naming convention: LC08_SST_YYYYMMDD_HHmmSS_PPPRRR_UTMZZZ
where:
- YYYYMMDD – date of granule data acquisition: year, month, day
- HHmmSS – granule center time (UTC): hour, minutes, seconds
- PPPRRR – WRS path and row
- ZZZ – UTM zone
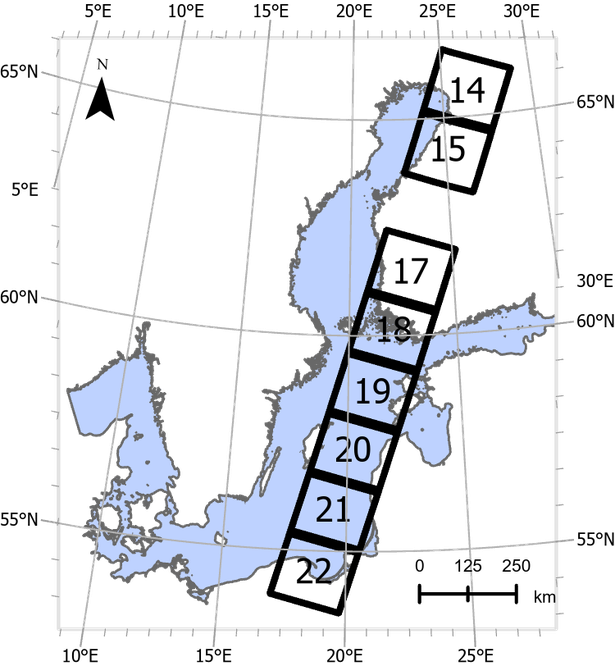
Figure 1. Granules of the Landsat 8 path number 190, which cover the Baltic Sea area. Numbers identify row of the path.
Plik z danymi badawczymi
hexmd5(md5(part1)+md5(part2)+...)-{parts_count} gdzie pojedyncza część pliku jest wielkości 512 MBPrzykładowy skrypt do wyliczenia:
https://github.com/antespi/s3md5
Informacje szczegółowe o pliku
- Licencja:
-
 otwiera się w nowej karcie
CC BYUznanie autorstwa
otwiera się w nowej karcie
CC BYUznanie autorstwa
Informacje szczegółowe
- Rok publikacji:
- 2021
- Data zatwierdzenia:
- 2021-11-25
- Język danych badawczych:
- angielski
- DOI:
- Identyfikator DOI 10.34808/08a1-dd15 otwiera się w nowej karcie
- Seria:
- Weryfikacja:
- Politechnika Gdańska
Słowa kluczowe
Powiązane zasoby
- publikacja Landsat 8 Data as a Source of High Resolution Sea Surface Temperature Maps in the Baltic Sea
Cytuj jako
Autorzy
wyświetlono 271 razy