Opis
The aim of the research is investigation of the efficiency of weight averaging of pulse frequency modulated signal. It was shown that from the point of view of the reduction of the sampling error the best are polynomial weighing functions, for which the maximum of this component error decreases proportionally to the appropriate power of the number of pulses counted during the averaging time. In the case of high interferences, whose frequencies are unstable or may change over a wide range, the specified level of their suppression together with reduction of the sampling effect can be achieved using weighting functions (windows) with appropriate level of side lobes. The effectiveness of using several trigonometric weighing functions was analyzed. The level of interference suppression for five selected frequencies and five input signal values as well as the sampling error when using the Blackman weighing function were tested using a simulation method.
Study of the errors caused by sampling weight function (window) by VFC pulses
The parameters in the following studies were: VFC: Un=10 V, fn =10 kHz, Sf=1 kHz/V. Averaging time: Tav= 60 ms. Input unipolar voltages: Uin1=4.548833 V Uin2=4.551167 V,; output frequencies fout1=4.548833 kHz, fout2=4.551167 kHz,; periods Tout1= 0.19724 ms, Tout2= 0.19837 ms. For these values, the products Tav∙fout1= 272.93, Tav∙fout2= 273.07, are close to each other, but the total number of periods in the weighted averaging duration differ by 1 (Nx1=272, Nx2=273,) which resulting in averaging error values close to the maximal values. Used averaging functions (windows): uniform (U), triangle (T), Blackman (B), Blackman-Harris (BH). Determined time moments are given in File 1. In simulation when Uin2=4.551167 V the time moments of appearance in output VFC (ms) when Um=0 (file tx_VFC_Um_0.txt).
Study of the periodic interferences suppression by weight averaging
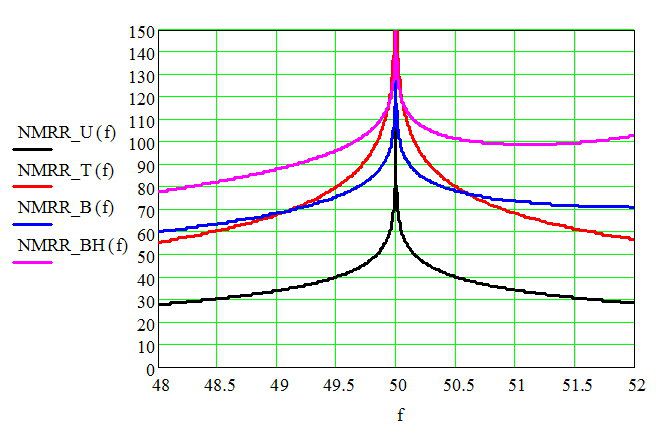
When studying interference suppression, there are two basic error components to consider: the first is directly related to the influence of the interference and the second is related to the influence of the window sampling (weighting function), analyzed above. Therefore, for each window, the NMRR depends not only on the frequency and initial phase of the interference but also on the sampling effect of the window. The parameters in the following studies were: VFC: Un=10 V, fn =10 kHz, Sf=1 kHz/V. Input voltage Uin1=4.551167 V, which is used above. Interference: amplitude Um=2.5 V, nominal frequency value fi.n=50 Hz, nominal period Tn=1/fi.n= 20 ms; frequencies: 48 Hz, 49 Hz, 49.5 Hz, 50 Hz, 50.5 Hz, 51 Hz, 52 Hz; phase shift: from 0 up to 360o by step 2o. Averaging functions (windows): uniform (U), triangle (T), Blackman (B). Averaging time: TU=Tn= 20 ms. TT =2Tn= 40 ms, TB =3Tn= 60 ms. The start of averaging is shifted of 5.125 ms for all windows. As example when Uin2=4.551167 V, interference frequency is 48 Hz for phase shift from 0 up to 360o by step 2o (180 values) the time moments of appearance in output VFC pulses are given in files tx_VFC_48_Hz.txt (48 Hz), tx_VFC_49_Hz.txt (49 Hz), tx_VFC_49_5_Hz.txt (49,5 Hz), tx_VFC_50_Hz.txt (50 Hz), tx_VFC_50_5_Hz.txt (50,5 Hz), tx_VFC_51_Hz.txt (51 Hz), tx_VFC_52_Hz.txt (52 Hz).
Values of NMRR are given in files NMRR_F_W.txt where F is frequency: 48 Hz, 49 Hz, 49.5 Hz, 50 Hz, 50.5 Hz, 51 Hz, 52 Hz and W is windows: uniform (U), triangle (T), Blackman (B).

Theoretical minimum values of NMRR for the frequency range 48 – 52 Hz


Theoretical minimum values of NMRR for the wide frequency range
Plik z danymi badawczymi
hexmd5(md5(part1)+md5(part2)+...)-{parts_count} gdzie pojedyncza część pliku jest wielkości 512 MBPrzykładowy skrypt do wyliczenia:
https://github.com/antespi/s3md5
Informacje szczegółowe o pliku
- Licencja:
-
otwiera się w nowej karcie
CC BYUznanie autorstwa
Informacje szczegółowe
- Rok publikacji:
- 2021
- Data zatwierdzenia:
- 2022-09-14
- Data wytworzenia:
- 2021
- Język danych badawczych:
- angielski
- Dyscypliny:
-
- Automatyka, elektronika i elektrotechnika (Dziedzina nauk inżynieryjno-technicznych)
- informatyka techniczna i telekomunikacja (Dziedzina nauk inżynieryjno-technicznych)
- DOI:
- Identyfikator DOI 10.34808/1eez-hp96 otwiera się w nowej karcie
- Weryfikacja:
- Politechnika Gdańska
Słowa kluczowe
Powiązane zasoby
- dane badawcze Experimental investigation of the weight averaging of pulse frequency modulated sensor output signal
Cytuj jako
Autorzy
wyświetlono 219 razy

