Opis
The presented data set is part of the research aimed at determining the actual characteristics of each thermistor in a package of twenty NTC10k type sensors.
The measurement system is shown in Fig. 1. A measurement system based on NI PXIe-1082Q (National Instruments Chassis), equipped with NI PXIe-8135 (Embedded Controller), NI PXIe-6341 (DAQ card) and NI SCB-68A (68-pin connector block), was used for the acquisition of measurement data. Eleven input channels of the DAQ card were used in the measurements. Channel 0 (ch_0) was used to measure the supply voltage. Sensors numbered 1 to 20 were tested in two parts, ten sensors per set. They were connected to the inputs of channels 1-10 (ch_1-ch_10) of the DAQ card.
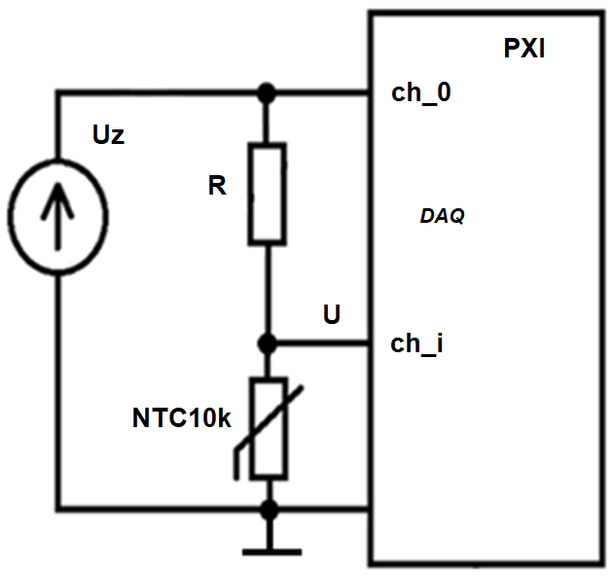
The conditioning unit for individual sensors is shown in Fig.2. These circuits are performed on connector block SCB-68A as the voltage dividers. For the set of ten thermistors, the supply voltage is measured in channel 0 (ch_0) of the DAQ card, and individual thermistors are connected to channels 1-10 (ch_i).
The thermistor set was placed in a thermal tank containing a mixture of water and ice at a temperature of 100°C (confirmed by a digital temperature gauge DT-34 with an accuracy of 0.1°C).
The calculations of the resistance values were performed based on the datasets [Maśnicki, R., Tyndzik, K., & Pałczyńska, B. (2021). Calibration of NTC 10k thermistors in temperature of 100 C [Data set]. Gdańsk University of Technology. https://doi.org/10.34808/hexp-sy19].

Fig. 1. The measurement setup
Datasets consist of 15 files 100,0Cx.lvm, and II10,0Cx.lvm (where: x is from 0 to 14), containing the measurement results supply voltages Uz (ch_0) (Fig. 2) and voltages at the outputs of ten voltage dividers (ch_1 to ch_10), repeated in two series (at 100.0°C, for two batches of thermistors, 10 per batch) with 30 measurements for each of the 11 channels. The resistance calculations were performed for 20 thermistors. The file Rt100.0C.lvm contains data for the first part (ten thermistors), and file RtII100.0C.lvm contains data for the second part (another ten thermistors) of 20 thermistors set. The last two lines show the averaged resistance values with standard deviations.

Fig. 2. The sensor conditioning unit
Plik z danymi badawczymi
hexmd5(md5(part1)+md5(part2)+...)-{parts_count} gdzie pojedyncza część pliku jest wielkości 512 MBPrzykładowy skrypt do wyliczenia:
https://github.com/antespi/s3md5
Informacje szczegółowe o pliku
- Licencja:
-
otwiera się w nowej karcie
CC BY-NCUżycie niekomercyjne
Informacje szczegółowe
- Rok publikacji:
- 2021
- Data zatwierdzenia:
- 2021-05-31
- Data wytworzenia:
- 2021
- Język danych badawczych:
- angielski
- Dyscypliny:
-
- Automatyka, elektronika i elektrotechnika (Dziedzina nauk inżynieryjno-technicznych)
- DOI:
- Identyfikator DOI 10.34808/nkkb-kw31 otwiera się w nowej karcie
- Seria:
- Weryfikacja:
- Politechnika Gdańska
Słowa kluczowe
Powiązane zasoby
- dane badawcze Calibration of NTC 10k thermistors in temperature of 0 C
- dane badawcze Calibration of NTC 10k thermistors in temperature of 100 C
- dane badawcze Calculations of the resistance values of 20 thermistors at 0°C
- dane badawcze Calculations of material factors for a set of 20 thermistors
- dane badawcze Calculations of the resistance values of 20 thermistors at 50°C
Cytuj jako
Autorzy
wyświetlono 141 razy

