Wyszukiwarka
Long-term measurements from a photovoltaic power plant and meteorological stations at the Laboratory LINTE^2 of Gdańsk University of Technology

Opis
1) The Laboratory LINTE^2 is a large research infrastructure operated by the Faculty of Electrical and Control Engineering at Gdańsk University of Technology, to be found in Gdańsk, Poland (54.3690 N, 18.6130 E).
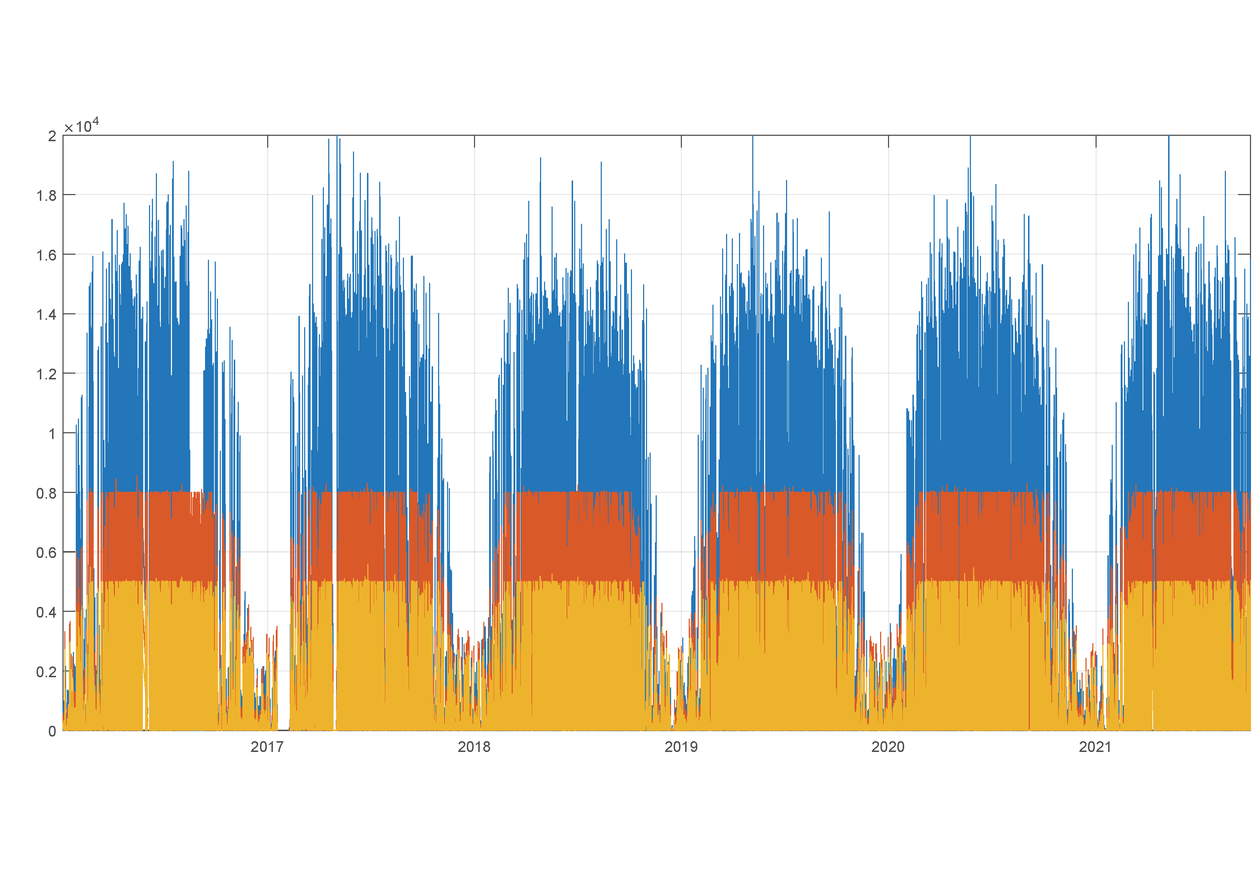
2) The measurements have been collected from a photovoltaic power plant located on the roof of the laboratory, having total capacity of 33 kWp. Electrical data have been gathered from three PV inverters (SMA Sunny Tripower type, indicated in the dataset by the suffixes: _inv#1, _inv#2, _inv#3), while data of weather conditions have been gathered from two meteorological stations (SMA Weather Station type, indicated in the dataset by the suffixes: _met#1, _met#2).
3) Raw measurements have been collected in the SCADA system of the laboratory. The dataset has been prepared using a script in MATLAB software that has converted data from the SCADA data flies into CSV file(s). The script has also eliminated incorrect data (indicated as NaN ) that might have happened due to failures of power plant devices or the SCADA system.
4) Date range of the dataset is from 1 Jan 2016 till 30 Sep 2021 (further additions of data are foreseen). The name of the file in the dataset indicates the date range of the dataset, using the following date format for the start and the end dates: yyyymmdd.
5) Time step of the measurements is 30 minutes.
6) The dataset is organized as follows:
|
Column in the CSV file |
Name of the measured data (column header in the CSV fie) |
Description |
|
A |
Date and time |
Format: month/day/year hour:minute:second AM/PM |
|
B |
P_AC_inv#1_W |
Total active power in all phases of pv inverter #1 (20 kWp) expressed in watts |
|
C |
P_AC_inv#2_W |
Total active power in all phases of pv inverter #2 (8 kWp) expressed in watts |
|
D |
P_AC_inv#3_W |
Total active power in all phases of pv inverter #3 (5 kWp) expressed in watts |
|
E |
Q_AC_inv#1_var |
Total reactive power in all phases of pv inverter #1 (20 kWp) expressed in vars |
|
F |
Q_AC_inv#2_var |
Total reactive power in all phases of pv inverter #2 (8 kWp) expressed in vars |
|
G |
Q_AC_inv#3_var |
Total reactive power in all phases of pv inverter #3 (5 kWp) expressed in vars |
|
H |
P_DC_inv#1_W |
DC input power of pv inverter #1 (20 kWp) expressed in watts |
|
I |
P_DC_inv#2_W |
DC input power of pv inverter #2 (8 kWp) expressed in watts |
|
J |
P_DC_inv#3_W |
DC input power of pv inverter #3 (5 kWp) expressed in watts |
|
K |
I_DC_inv#1_A |
DC input current of pv inverter #1 (20 kWp) expressed in amperes |
|
L |
I_DC_inv#2_A |
DC input current of pv inverter #2 (8 kWp) expressed in amperes |
|
M |
I_DC_inv#3_A |
DC input current of pv inverter #3 (5 kWp) expressed in amperes |
|
N |
U_DC_inv#1_V |
DC input voltage of pv inverter #1 (20 kWp) expressed in volts |
|
O |
U_DC_inv#2_V |
DC input voltage of pv inverter #2 (8 kWp) expressed in volts |
|
P |
U_DC_inv#3_V |
DC input voltage of pv inverter #3 (5 kWp) expressed in volts |
|
Q |
E_sum_inv#1_kWh |
Total electricity generated by pv inverter #1 (20 kWp) expressed in kilowatt-hours |
|
R |
E_sum_inv#2_kWh |
Total electricity generated by pv inverter #2 (8 kWp) expressed in kilowatt-hours |
|
S |
E_sum_inv#3_kWh |
Total electricity generated by pv inverter #3 (5 kWp) expressed in kilowatt-hours |
|
T |
Solar_rad_met#1_W_sq_m |
Solar radiation intensity measured by meteorological station #1 expressed in watts per square meter |
|
U |
Solar_rad_met#2_W_sq_m |
Solar radiation intensity measured by meteorological station #2 expressed in watts per square meter |
|
V |
Env_temp_met#1_C |
Ambient temperature measured by meteorological station #1 expressed in degrees Celsius |
|
W |
Env_temp_met#2_C |
Ambient temperature measured by meteorological station #2 expressed in degrees Celsius |
|
X |
Panel_temp_met#1_C |
PV panel temperature measured by meteorological station #1 expressed in degrees Celsius |
|
Y |
Panel_temp_met#2_C |
PV panel temperature measured by meteorological station #2 expressed in degrees Celsius |
|
Z |
Rel_humid_met#1_perc |
Relative humidity of air measured by meteorological station #1 expressed in percent |
|
AA |
Rel_humid_met#2_perc |
Relative humidity of air measured by meteorological station #2 expressed in percent |
|
AB |
Atm_pres_met#1_hPa |
Atmospheric pressure measured by meteorological station #1 expressed in hectopascals |
|
AC |
Atm_pres_met#2_hPa |
Atmospheric pressure measured by meteorological station #2 expressed in hectopascals |
Plik z danymi badawczymi
hexmd5(md5(part1)+md5(part2)+...)-{parts_count} gdzie pojedyncza część pliku jest wielkości 512 MBPrzykładowy skrypt do wyliczenia:
https://github.com/antespi/s3md5
Informacje szczegółowe o pliku
- Licencja:
-
 otwiera się w nowej karcie
CC BYUznanie autorstwa
otwiera się w nowej karcie
CC BYUznanie autorstwa
Informacje szczegółowe
- Rok publikacji:
- 2021
- Data zatwierdzenia:
- 2021-12-21
- Język danych badawczych:
- angielski
- Dyscypliny:
-
- Automatyka, elektronika i elektrotechnika (Dziedzina nauk inżynieryjno-technicznych)
- DOI:
- Identyfikator DOI 10.34808/06j6-gt25 otwiera się w nowej karcie
- Weryfikacja:
- Politechnika Gdańska
Słowa kluczowe
- photovoltaic power plant
- photovoltaic systems
- pv system
- solar pv system
- weather conditions
- measurements
Powiązane zasoby
- laboratorium Laboratorium LINTE^2
- projekt Laboratorium Innowacyjnych Technologii elektroenergetycznych i Integracji odnawialnych źródeł energii – LINTE^2
Cytuj jako
Autorzy
wyświetlono 529 razy